Latest News
See what’s happening at SGVMWD.
Notice of Intent: Statewide National Pollutant Discharge Elimination System Permit for Residual Pesticide Discharges to Waters of the United States from Aquatic Animal Invasive Species Control Applications
Statewide National Pollutant Discharge Elimination System Permit for Residual Pesticide Discharges to Waters of the United States from Aquatic Animal Invasive Species Control Applications.
Career Opportunity – System Operator/Inspector
SGVMWD is seeking a System Operator/Inspector.
Water Supply Update
California • State Water Project
October 2026
SWP Allocation
45% 12,960 of 28,800 acre-feet
Lake Oroville
75% capacity
110% of average
San Luis Reservoir
60% capacity
95% of average
Simplified State Water Project route
U.S. Drought Monitor
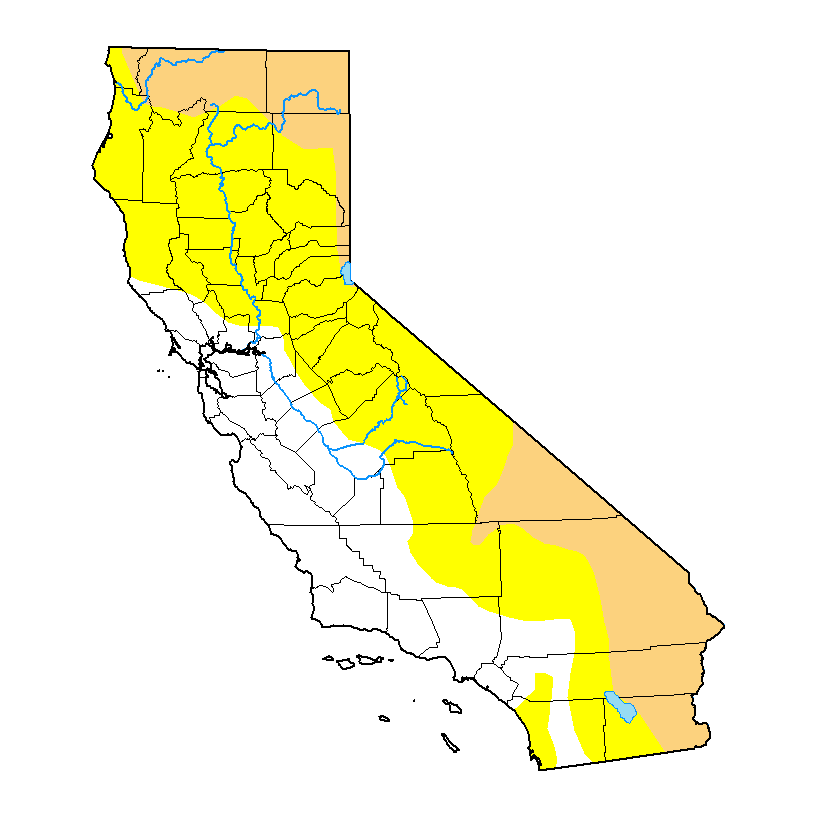
- N/AAbnormally Dry
- 39.56%Moderate
- 23.01%Severe
- 4.7%Extreme
- 0%Exceptional
67.27% of California in moderate drought or worse
Local Rainfall
9.13in
48% of average
Water Year 2024–2025
CA Snowpack
1%
of April 1 average
CA Reservoirs
72%
of capacity
108% of average
Groundwater Levels
Main San Gabriel Basin
250.3ft
above mean sea level
Raymond Basin
Sierra Madre Well
490.50ft
above mean sea level
View current conditions from the California Department of Water Resources’ California Water Watch. The U.S. Drought Monitor is jointly produced by the National Drought Mitigation Center at the University of Nebraska-Lincoln, the United States Department of Agriculture, the National Oceanic and Atmospheric Administration and the National Aeronautics and Space Administration. Map courtesy of NDMC.