
Water Supply Update
California • State Water Project
October 2026
SWP Allocation
45% 12,960 of 28,800 acre-feet
Lake Oroville
45% capacity
126.9% of average
San Luis Reservoir
73% capacity
102.4% of average
Simplified State Water Project route
U.S. Drought Monitor
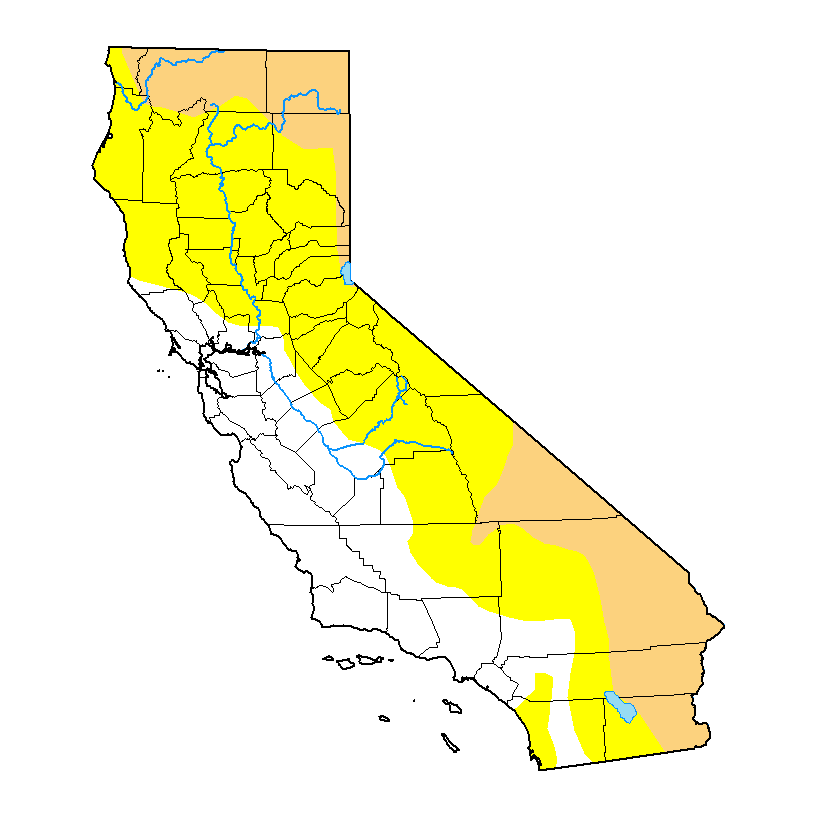
- 72.12%Abnormally Dry
- 23.26%Moderate
- 0%Severe
- 0%Extreme
- 0%Exceptional
23.26% of California in moderate drought or worse
Local Rainfall
0.5in
2.2% of average
Water Year 2026–2027
CA Snowpack
0%
of April 1 average
CA Reservoirs
59%
of capacity
106% of average
Groundwater Levels
Main San Gabriel Basin
249.2ft
above mean sea level
Raymond Basin
Sierra Madre Well
496.3ft
above mean sea level
View current conditions from the California Department of Water Resources’ California Water Watch. The U.S. Drought Monitor is jointly produced by the National Drought Mitigation Center at the University of Nebraska-Lincoln, the United States Department of Agriculture, the National Oceanic and Atmospheric Administration and the National Aeronautics and Space Administration. Map courtesy of NDMC.